
When the row of dots sits below the candles, Parabolic SAR is tracking an uptrend; when it sits above them, a downtrend. The dots change sides on the candle whose price crosses that candle's dot, and the new dot lands on the highest or lowest price the previous run reached.
How far each dot moves toward price is set by three numbers in the settings: the acceleration factor starts at 0.02, goes up by 0.02 each time the trend makes a new high (a new low in a downtrend), and stops at 0.20. SAR stands for Stop and Reverse. J. Welles Wilder introduced it in New Concepts in Technical Trading Systems, published in 1978, the same book that introduced RSI and ATR (Average True Range).
1. Dots below the candles mean an uptrend, dots above mean a downtrend
The TradingView Help Center page Parabolic SAR (SAR) describes it as a time and price technical analysis tool "primarily used to identify points of potential stops and reverses". The calculated points form a parabola that sits below price during a bullish trend and above price during a bearish trend. Each dot is one SAR value and belongs to one candle.
| Where the dots are | Trend SAR is tracking | What EP is in the formula | What counts as a cross |
|---|---|---|---|
| Below the candles | Up | The highest price reached in this run | The candle's price falls below the dot |
| Above the candles | Down | The lowest price reached in this run | The candle's price rises above the dot |
EP is the Extreme Point. AF is the Acceleration Factor, which determines the sensitivity of the SAR. Those two, plus the previous candle's SAR, are everything the formula takes in.
On TradingView the default visual style for the dots is Cross. The Style tab lets you change the style, the color and the thickness, and none of that changes how the dots are read.
2. When do the SAR dots flip to the other side?
On every new candle, three things happen in order.
- The current SAR is calculated from the previous candle's three values:
Current SAR = Previous SAR + Previous AF × (Previous EP − Previous SAR) - That value is checked against the current candle's price. If price has penetrated it, a reversal is made and the previous EP becomes the new SAR.
- If there's no reversal, the value is checked against the two previous lows (uptrend) or the two previous highs (downtrend); if it has moved past them, it's adjusted by the rule in section 5.
On a candle where EP is updated, AF goes up by one increment. Uptrends and downtrends use the same expression: in an uptrend EP is above SAR, the bracket is positive and SAR rises candle after candle; in a downtrend EP is below SAR, the bracket is negative and SAR falls candle after candle.
On the candle where the flip happens, the dot lands on the previous run's extreme. Going from up to down, the new SAR is the highest price reached during the uptrend; going from down to up, it's the lowest price reached during the downtrend. AF returns to its starting value and EP starts over for the new run.
TradingView's help page is careful about what a cross means: price breaking below the parabola in an uptrend signals a potential reversal, and price breaking above it in a downtrend can also signal one. Traders use these breakthroughs as a point to place stop orders or to enter at the beginning of a new trend; the summary on the same page says SAR isn't typically recommended as a stand-alone for generating trading signals.
3. Calculating SAR, EP and AF candle by candle across 8 candles
The book that introduced SAR, TradingView's help page says, has no clear instructions for calculating it at the beginning of a data series. TradingView handles it this way: the first candle gets no SAR; on the second, the trend direction comes from comparing the closes of the first two candles, and the second candle's SAR is the first candle's low if the trend is up, or the first candle's high if the trend is down. The 8 candles below start that way and use the default 0.02, 0.02 and 0.20.
| Candle | High | Low | Close | Value from the formula | SAR on this candle | EP after the close | AF after the close |
|---|---|---|---|---|---|---|---|
| 1 | 102 | 98 | 100 | — | — | — | — |
| 2 | 105 | 100 | 104 | — | 98 (below the candle) | 105 | 0.02 |
| 3 | 108 | 103 | 107 | 98.14 | 98 (limited by the two previous candles) | 108 | 0.04 |
| 4 | 112 | 106 | 111 | 98.40 | 98.40 | 112 | 0.06 |
| 5 | 116 | 110 | 115 | 99.216 | 99.216 | 116 | 0.08 |
| 6 | 114 | 109 | 110 | 100.559 | 100.559 | 116 | 0.08 |
| 7 | 111 | 100 | 101 | 101.794 | 116 (flips above the candle) | 100 | 0.02 |
| 8 | 104 | 96 | 97 | 115.68 | 115.68 | 96 | 0.04 |
The prices of the 8 candles are made-up demo data. SAR is shown to three decimal places; the unrounded value is carried into the next candle.
- Candle 2: the close of 104 is above candle 1's 100, so the trend is set as up. SAR takes candle 1's low of 98, EP is the highest price reached in this run, 105, and AF uses the starting value of 0.02.
- Candle 3: 98 + 0.02 × (105 − 98) = 98.14. The candle's low is 103, so price doesn't touch it. But 98.14 is above candle 1's low of 98, so the limit rule swaps in the lower of the two previous lows, which is still 98. The high of 108 beats 105, so EP becomes 108 and AF goes up to 0.04.
- Candle 4: 98 + 0.04 × (108 − 98) = 98.40. The two previous lows are 103 and 100, both above it, so nothing changes. The high of 112 is a new high, so EP becomes 112 and AF goes up to 0.06.
- Candle 5: 98.40 + 0.06 × (112 − 98.40) = 98.40 + 0.816 = 99.216. The high of 116 is another new high, so EP becomes 116 and AF goes up to 0.08.
- Candle 6: 99.216 + 0.08 × (116 − 99.216) = 99.216 + 1.34272 ≈ 100.559. The high of 114 doesn't beat 116, so EP and AF stay where they are.
- Candle 7: 100.55872 + 0.08 × (116 − 100.55872) = 100.55872 + 1.2353024 ≈ 101.794. This candle's low is 100, below 101.794, so the value is penetrated. SAR becomes the previous EP, 116, and the dot jumps from candle 6's 100.559 (below the candle) to 116 (above the candle). The new run is tracked as a downtrend: EP is this candle's low of 100 and AF goes back to 0.02.
- Candle 8: 116 + 0.02 × (100 − 116) = 116 − 0.32 = 115.68. The candle's high is 104, so price doesn't touch it; the two previous highs are 111 and 114, both below 115.68, so nothing changes. The low of 96 is below 100, so EP becomes 96 and AF goes up to 0.04.
Everything on the right-hand side of the formula is fixed once the previous candle closes, so candle 9's SAR can be written down before that candle has traded: 115.68 + 0.04 × (96 − 115.68) = 115.68 − 0.7872 ≈ 114.893. As long as candle 9's high stays under 114.893, the dot stays where it is.
4. What do Start 0.02, Increment 0.02 and Max Value 0.20 each control?
All three inputs control AF.
| Input | Default | What it controls | In the 8 candles above |
|---|---|---|---|
| Start | 0.02 | The starting value for the Acceleration Factor | AF is 0.02 on candle 2 and again on candle 7 after the flip |
| Increment | 0.02 | The increment in which the Acceleration Factor moves | Candles 3, 4 and 5 make new highs and candle 8 makes a new low; each adds 0.02 |
| Max Value | 0.20 | The maximum value of the Acceleration Factor | AF only gets to 0.08 and never reaches the cap |
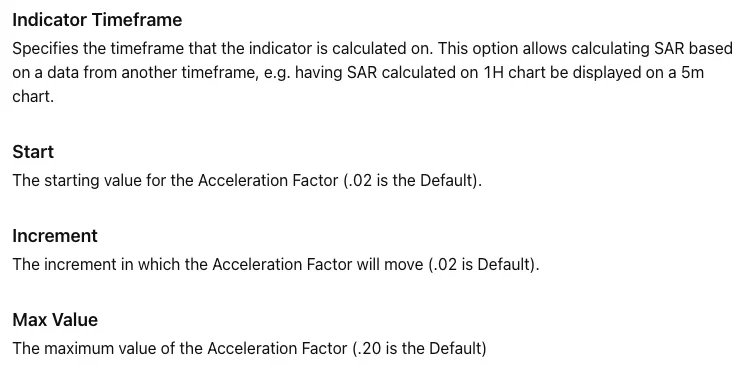
Inside the formula, AF is the share of the gap to EP that the dot closes on each candle. With SAR and EP 10 points apart, the dot moves 0.2 points on that candle when AF is 0.02 and 2 points when AF is 0.20. The more new extremes a trend makes, the larger AF gets and the more closely the dots follow price. Getting from 0.02 to 0.20 takes 9 increases, which means 9 candles in the run have to make a new extreme; once AF is at the maximum it stays there until a reversal.
On changing the settings, Binance Academy's A Brief Guide to the Parabolic SAR Indicator says an AF higher than 0.02 increases sensitivity and gives more reversal signals, an AF lower than 0.02 gives fewer signals and a slower-moving indicator, and higher sensitivity increases the chances of false signals. It also passes on Wilder's view that 0.02 increments worked best overall. After changing any of the three inputs, make sure anyone you compare dot positions with has entered the same three numbers.
In TradingView's settings one more input sits ahead of these three: Indicator Timeframe, which specifies the timeframe the indicator is calculated on, for example SAR calculated on a 1H chart and displayed on a 5m chart. If your dots don't line up with someone else's chart, check this input too.
5. SAR never moves past the lows or highs of the two previous candles
The value from the formula has one more limit to pass: SAR can't move into the range of the previous candle or the one before it.
- In an uptrend, SAR can't be above the low of the previous candle or of the one before it. If the calculated value is higher, the lower of those two lows becomes the SAR.
- In a downtrend, SAR can't be below the high of the previous candle or of the one before it. If the calculated value is lower, the higher of those two highs becomes the SAR.
After an adjustment, the next candle's calculation starts from the adjusted value. Candle 3 in section 3 is one case: the formula gives 98.14, the two previous lows are 100 and 98, 98.14 is above 98, and SAR ends up at 98. A downtrend works the other way round: if the formula gives 50 and the two previous highs are 51 and 52.5, SAR is 52.5.
With the starting method from section 3, candle 3 of a series that opens in an uptrend runs into this limit every time, unless that candle is itself penetrated and a reversal is made. Candle 2's SAR is candle 1's low and the formula adds a positive number to it, so the result is bound to be above candle 1's low, and candle 1 is exactly the candle before the previous one.
The order of the checks is fixed: first whether the candle's price has penetrated the calculated value, and only when there's no reversal does this limit come in.
6. Why does SAR keep flipping in a sideways market?
A flip takes just one candle whose price crosses the dot. In a trending market the dot starts from the previous run's extreme and closes in slowly from a distance. In a sideways market the previous extreme is close to the current price, so the new dot lands right next to price and gets crossed again as soon as price swings back. Binance Academy's guide lists the same weakness: the dots flip from one side to another frequently in consolidation, false signals are more likely when there is no clear trend, and a choppy market that moves up and down rapidly can also produce numerous misleading signals. OKX's SAR lesson makes the same point about markets that keep swinging back and forth, where buy and sell signals come very frequently.
The flip itself doesn't come early either. In the section 3 example, price peaks at 116 on candle 5 and the dots don't flip until candle 7, which closes at 101. The dots trail price, so following them won't get you in at the low or out at the high.
SAR uses only time and price, so it gives a trend's direction and duration but can't measure how strong the trend is. TradingView's summary suggests using it together with an indicator that specializes in measuring trend strength and names Wilder's own Directional Movement. Binance Academy's guide mentions that Wilder recommended using the Average Directional Index (ADX) alongside Parabolic SAR to gauge trend strength, and adds that because SAR doesn't consider trading volume, it provides limited information about trend strength. OKX's lesson looks at the distance between the dots and the candles, and reads a longer distance as a stronger rally or decline in progress.