🌈 Bitcoin Rainbow Chart
9-band log regression model — auto-locates which band BTC is in right now. CoinGecko live data.
Open ToolHistory: BTC tops appeared 12-18 months after halving in all 3 prior cycles. The 5th cycle started 2024-04-20 — you are now in —.
Funding rate / long-short ratio / open interest / liquidation map / on-chain metrics — one deep longform per indicator, with real historical replays, common-misread case studies, and counter-examples for when the indicator is useless.
⚡ The tools tagged "LIVE" call CoinGecko / Binance / alternative.me public APIs directly from your browser — our server never sees the data. The rest are pure front-end calculators.
9-band log regression model — auto-locates which band BTC is in right now. CoinGecko live data.
Open ToolBTC/ETH/SOL/BNB and 8 majors — RSI(14) all on one screen. Binance API, 30-second auto refresh.
Open ToolLive half-circle needle + 90-day curve + 5-zone reading. alternative.me API.
Open ToolPaste a custom price series (any coin, any timeframe) — Wilder smoothing formula, exact math.
Open ToolEMA12, EMA26, signal line, histogram. Visualize golden and death crosses.
Open ToolHistorical tops >7, bottoms <0.1. Tells you where this cycle sits.
Open ToolFrom win-rate + payoff ratio back into a max position size — a pro-trader starting point.
Open ToolTranslates 0.01% into 10.95% annualized plus a real daily cost number.
Open ToolSpot + perp carry — outputs annualized yield and max drawdown estimate.
Open ToolEntry, leverage, side — out comes the rough price you get force-closed at.
Open ToolFrom acceptable loss back into the size you should actually open.
Open ToolRange + grid count → per-grid profit, margin, liquidation boundary.
Open ToolDays to next halving + side-by-side with the past three cycles.
Open ToolThree content types: guides, deep methodology longforms, event recap briefs. Every data point is sourced to a checkable place — Binance candle, Coinglass, alternative.me. When we get something wrong we publish a public diff on the corrections page.

Long/short redistribution every 8 hours. Read this and you'll understand why a pullback almost always follows a vertical rally.
Read
The 4 mainstream L/S formulas each tell a different story. Which one is useful to you?
Read
Price sideways while OI rips 30% — usually the final loading before a big move.
Read
Before big orders get wiped, the whole liquidation pool was already sitting there waiting.
Read
On-chain data is a medium-to-long-term tool — not a 5-minute entry signal.
Read
Why the 14-period default is 14, when "70" isn't a sell, and how to read divergence.
Read
Most people only watch the cross — but MACD has 3 other signals that work better.
Read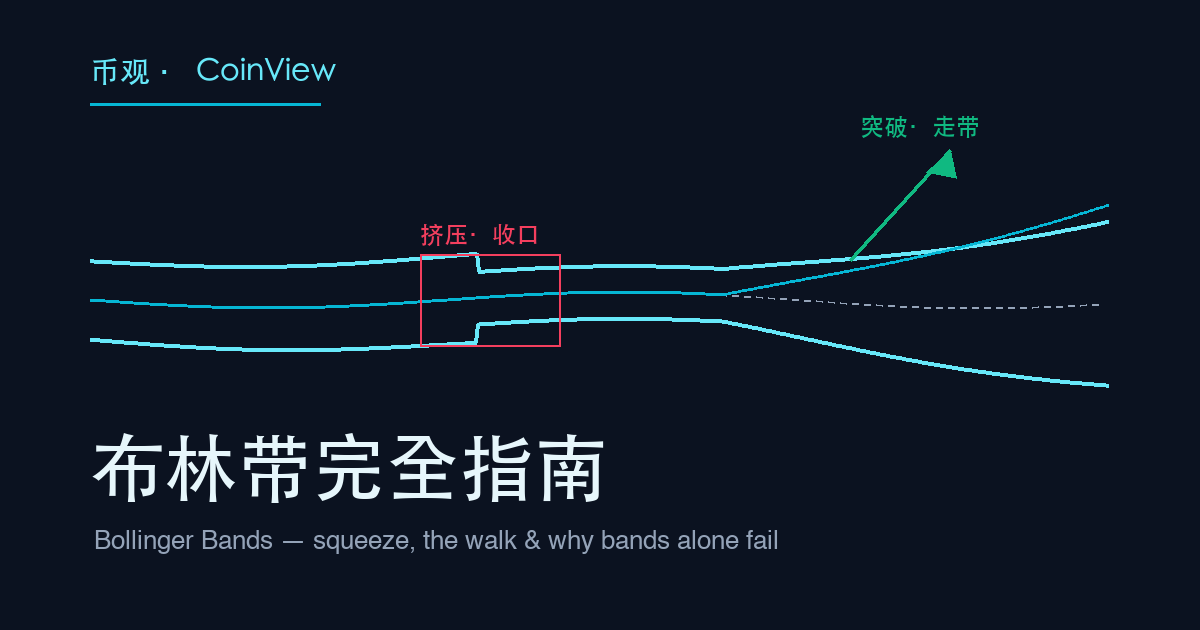
It's not "sell the top, buy the bottom" — it's bandwidth. The squeeze, the walk and the false-breakout trap.
Read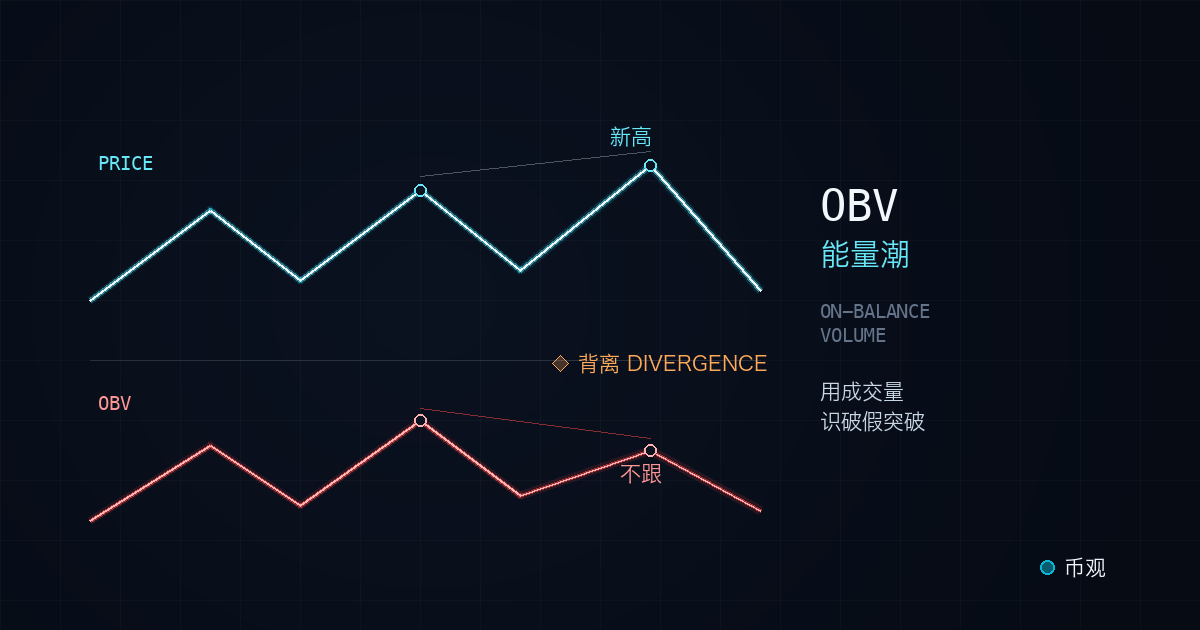
Accumulate volume into one line to confirm real breakouts — and why exchange wash trading can make it lie.
Read
Three historical cycles replayed + what's unusual about the 2024 halving (cycle 4).
Read
"Altseason" isn't a vibe — it's the intersection of 4 quantifiable indicators.
Read
"F&G 25 = buy the dip", "negative funding = go long" — where the logic breaks.
Read
What CoinGlass, Glassnode, CryptoQuant, and Coinalyze are each actually good at.
Read
90 minutes on Sunday night — Monday open you're not flying blind.
Read
When US institutions and Korean retail bet opposite directions — who moves first?
Read
CME weekend gaps fill 80%+ statistically — but the fill timing varies a lot.
ReadWhen a large transfer is a danger sign and when it's just noise.
Read
Options data shows you the pros' positioning — not retail mood.
Read
Stablecoin mcap + exchange balance = how much dry powder, and where it sits.
Read
Win rate 60% + payoff 1.5 — what does Kelly say? And how do you use half-Kelly?
ReadS2F broken + sample too small + ETFs rewrote the rules — we lay the objective signals out, not pad the word count.
ReadClose was only down 7%, but the intraday low was -15.7%. Liquidations happen at the low, not the close.
Read+0.01% in calm markets / -0.05% sustained. Negative funding isn't "bearish" — it's "willing to pay to stay short".
ReadBoth right, different questions. 4h gives you a 56-hour temperature, 1d gives you a 14-day one.
Read7-day cumulative / concentration / GBTC outflow share — the 3 dimensions for reading ETF flow.
ReadLUNA in May 2022 was a shared scar for the crypto crowd. In hindsight, on-chain data (exchange UST balances, Anchor deposit changes), derivatives indicators (funding turning negative 6 days early), SOPR — half a dozen core indicators were shouting from the data two weeks before the collapse, and most retail traders couldn't read what they were shouting. CoinView exists for that problem: to write down how to read these indicators, plainly.
This site doesn't sell courses, doesn't run paid groups, doesn't host KOL shilling. All calculators pull live data from Binance, CoinGecko, and alternative.me public APIs. Every event case in every article is tied to a data point you can verify on Binance candles, Coinglass, or Glassnode.
We are in an Affiliate relationship with Binance. Our public referral code is BN16188. If you register with that code and trade, we receive a referral service fee — this money comes out of Binance's marketing budget, not from your trading fees, and never adds a cent to them. It is currently the only revenue source for this site, and no content goes soft because of it. Read the full disclosure.