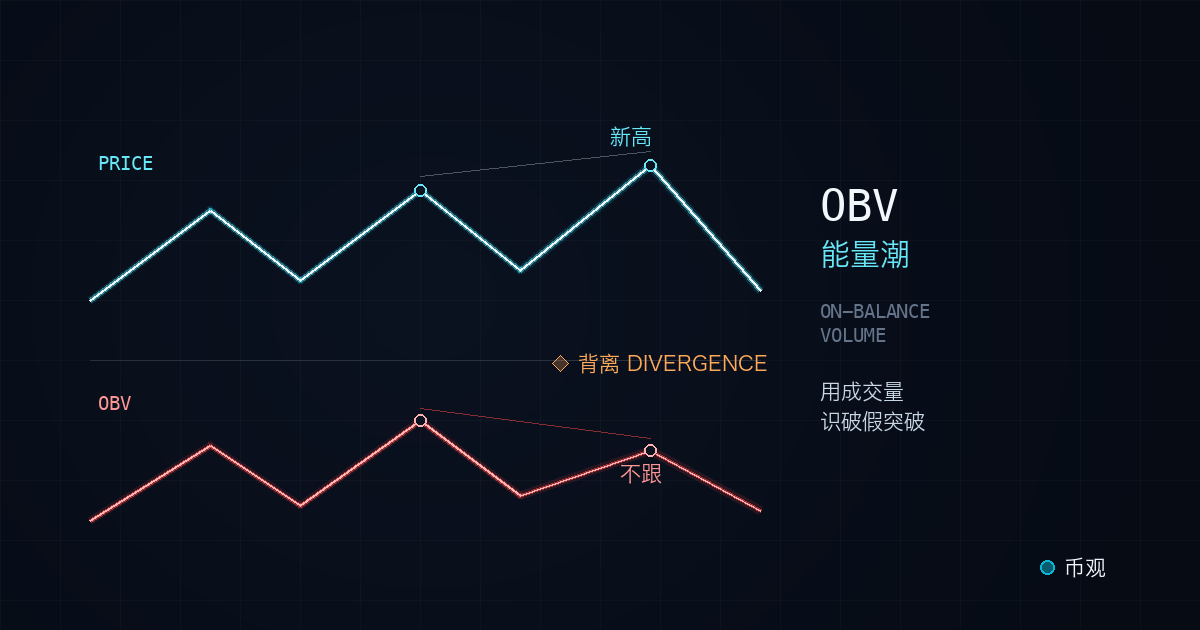
Most people watching a chart keep their eyes on price and give the volume bars a passing glance. Veteran traders say it differently: price can lie, volume tells the truth. A single large order can yank price higher in seconds, but sustaining that move takes a steady stream of volume behind it. On-Balance Volume (OBV) is the tool that turns that "sustaining force" into a single line. Joe Granville introduced it in 1963 (Wikipedia: On-Balance Volume), built on one core belief: volume leads price. This guide covers how OBV is calculated, how to use it to catch fake breakouts, and when it lies to you in crypto markets.
1. What OBV actually measures — turning volume into a single line.
First, separate OBV from the volume histogram you already know. A volume bar shows each candle's volume standing on its own — all you get from it is "was today busy." OBV takes that same volume, signs it by the day's direction and runs it into a running total, producing one continuous line.
Think of it like foot traffic in and out of a shopping mall. The volume histogram is the total headcount each day, entries and exits lumped together, undifferentiated. OBV is "people in minus people out," accumulated day after day — net 100 in today, net 30 out tomorrow, net 50 in the day after, all added up into a single curve that shows whether the mall is filling up or emptying out. A rising line means net inflow; a falling line means net outflow.
So OBV's job is to measure the direction of capital flow, not price itself. It answers one question: is there real money behind this price move. That single job is what makes it useful for one thing above all — checking whether a price move is genuine.
2. How OBV is calculated (three rules).
The formula fits in one sentence, and you can run the direction in your head. For any period — daily is standard — compare today's close to yesterday's:
- Today's close > yesterday's close: OBV = yesterday's OBV + today's volume (buyers win, the volume counts as inflow).
- Today's close < yesterday's close: OBV = yesterday's OBV − today's volume (sellers win, the volume counts as outflow).
- Today's close = yesterday's close: OBV stays flat.
That's the whole formula, and it immediately tells you something important: OBV's absolute value means nothing. It accumulates from whatever starting point the calculation began at, so the number you see is a function of that starting point, not anything meaningful on its own. Read the direction and slope instead — is the line rising or falling, and is that rise steepening or flattening. Treat the y-axis as if it doesn't exist and read the shape of the line (Investopedia: OBV definition).
The formula also exposes a built-in limitation: OBV adds or subtracts the full day's volume in one shot regardless of whether the close was up 0.1% or up 10%. So a single abnormal volume spike — even on a barely-green candle — produces an oversized jump in OBV. That's the root cause of the short-timeframe noise covered later in this guide.
3. Use 1: trend confirmation — volume needs to back the move.
OBV's most basic, and most reliable, use is trend confirmation. The logic is straightforward: in a healthy uptrend, OBV should be making new highs alongside price — meaning fresh capital is stepping in on every leg up. In a healthy downtrend, OBV should be making new lows alongside price too.
So the first thing to do with OBV plotted under price isn't hunt for a signal — it's check whether the two lines agree:
- Price up + OBV up = the rally has volume behind it, the trend is healthy, stay with it.
- Price down + OBV down = the decline is confirmed by volume, don't rush to buy the dip.
- Price and OBV start disagreeing = a warning — that's the divergence covered next.
One practical detail: when OBV is rising, the change in slope matters more than its absolute position. If OBV keeps steepening while price rises, incoming capital is accelerating. If price is still climbing but OBV's rise flattens out, that's an early soft signal that buyers are starting to lag — and it often shows up before an actual divergence forms.
4. Use 2: OBV divergence — the core breakout filter.
This is OBV's highest-value use, and the reason it's sometimes called a fake-breakout detector. Divergence happens when price and OBV disagree on direction:
- Bearish (top) divergence: price prints a new high, but OBV doesn't confirm it — or even turns down. Meaning: this rally is running on thin volume, buying is exhausting, and the breakout is probably fake. Watch for a reversal.
- Bullish (bottom) divergence: price prints a new low, but OBV doesn't follow. Meaning: selling pressure is fading, downside momentum is exhausting, a bottom may be near.
Why does top divergence catch fake breakouts? Picture the scene: a coin finally breaks above a high it's been stuck under for weeks. The candle looks clean, and traders pile in the moment they see "breakout." But if the volume on that breakout candle isn't actually bigger than what came before it, OBV won't make a new high alongside it — which tells you the amount of capital that pushed through the old high wasn't much. It's entirely plausible that a small amount of money nudged price through the level to draw in buy orders, then sold into them. The new high in price is real, but the volume behind it is thin. When OBV doesn't confirm, it's telling you this breakout isn't backed by real money.
Fake breakouts of this shape are extremely common in crypto, and the structure is almost always the same — you can verify it yourself on any major coin's chart with OBV overlaid. Price consolidates for a stretch, then a green candle punches through the prior high. On the price chart alone, that's a textbook breakout. But pull up OBV and the candle that broke the high doesn't produce a new high on OBV — it's still sitting below the previous peak, sometimes drifting lower for several days already.
What usually follows: price hovers above the new high for a day or two without volume ever confirming it, then drops back below the breakout level — a fake breakout that fades. Whoever chased the move gets stuck near the top. OBV's value here isn't calling the exact reversal — it's stopping you at the moment you're about to chase: the breakout happened, but volume didn't show up, so don't go all-in yet. Add that one rule to your breakout playbook and it filters out a meaningful share of good-looking-but-hollow breakouts.
Worth flagging: divergence isn't a precise timing tool. After a top divergence appears, price can absolutely keep grinding higher for another week or two before actually reversing — crypto's leverage-driven flows are strong enough to push price on well past the point where volume stopped confirming it. Treat OBV divergence as a "cut size, raise alertness" signal, not a "flip short right now" trigger.
5. Crypto's own trap: wash trading can make OBV lie.
Everything above assumes one thing: the volume data is real. That assumption mostly holds in equity markets. In crypto — especially on smaller exchanges and lower-cap coins — it often doesn't.
The cause is wash trading. Market makers, project teams, even exchanges themselves can trade against their own orders, or match buy and sell orders back and forth, to inflate a coin's reported volume without any real capital changing hands. Feed that manufactured volume into OBV and you get a line that looks like a wave of inflow but is actually built on nothing. You think you're seeing strong volume support; you're actually reading fabricated numbers. Public industry research has repeatedly pointed to significant volume inflation across parts of the exchange landscape, and it tends to be worst on low-cap coins.
So using OBV in crypto means holding three boundaries:
- Trust OBV only on top-tier assets: BTC, ETH and the most liquid major spot pairs have relatively real volume, so OBV holds up well there.
- Treat low-cap alts and freshly listed contracts with suspicion: these are the easiest targets for wash trading, and OBV's flow line on them can be entirely fictional.
- Cross-check when in doubt: verify against real on-chain transfer data, or volume aggregated across multiple major exchanges, rather than trusting one exchange's reported number alone.
This is the single biggest difference between crypto OBV and textbook stock-market OBV. No textbook warns you about it, because textbooks assume the volume is real. In this market, you have to ask "is this volume real" first, before deciding whether to trust OBV at all.
6. Which timeframes and assets OBV actually holds up on.
Here's where the reliability boundary sits, laid out plainly:
| Dimension | OBV is reliable | OBV needs scrutiny |
|---|---|---|
| Timeframe | Daily / weekly | 15m / 1h short timeframes |
| Asset | BTC · ETH · top major spot pairs | low-cap alts · new contracts |
| Market condition | clear trend, real volume | wash-traded, very low liquidity |
| Use case | confirming breakouts · medium-term flow | precise timing · catching short-term turns |
On timeframe, daily is OBV's home turf. Its core use — reading medium-term capital flow direction and confirming breakouts — has the best signal-to-noise ratio on the daily chart. The trouble with short timeframes was covered earlier: OBV adds or subtracts the whole day's volume in one shot based on the close, so a single abnormal volume spike inside a 15-minute candle can yank OBV into a false turning point, which means divergence signals fire constantly but mostly don't hold up. If you trade short-term, you can watch 4h OBV, but always filter it against the daily OBV direction — only act when both timeframes agree, and default to the larger timeframe when they don't.
7. Pairing OBV with other indicators.
OBV is a confirmation tool, not a trigger — its strength is checking whether a price move has real volume behind it, not generating precise buy or sell points on its own. So the best use is as a filter, stacked with other indicators:
- + Price structure: at a break of a prior high or low, check whether OBV confirms with a new high or low of its own before trusting the move. This is OBV's primary pairing.
- + MACD: MACD reads momentum direction, OBV reads whether volume backs it. A MACD golden cross that OBV doesn't confirm is a lower-conviction cross.
- + Funding rate / long-short ratio: OBV reflects spot capital flow, while funding rate and long/short ratio reflect derivatives sentiment — reading both together helps separate real spot buying from leverage-driven positioning.
- + Position sizing: OBV adjusts how much you trust a signal; your actual downside is still capped by a position size calculator.
One line to close the loop: OBV doesn't tell you to buy or sell — it only answers a more basic question: is there real money behind this move. Get that question answered and you're a lot less likely to be the one left holding the bag at a breakout or a divergence.
8. FAQ.
Does the absolute level of OBV mean anything?
No. OBV accumulates from an arbitrary starting point, so the absolute number itself is meaningless — the same asset can show wildly different OBV values depending on where the calculation began. What's actually useful is direction and slope: is OBV rising or falling, and is that rise steepening or flattening. Read OBV as a trendline with no meaningful y-axis, not a value to memorize.
How is OBV different from a volume histogram?
A volume bar shows the volume for one candle in isolation, standing on its own. OBV takes that same volume, signs it by the day's close (up adds, down subtracts), and runs it into one continuous cumulative line. Bars tell you whether today was busy; OBV tells you whether capital has been net flowing in or out over time. That accumulated direction is the whole value OBV adds over reading raw volume bars.
What actually counts as a valid OBV divergence?
Bearish (top) divergence: price makes a new high but OBV doesn't confirm it — the rally is running on thin volume, buying is exhausting, and the breakout is likely fake. Bullish (bottom) divergence: price makes a new low but OBV doesn't follow — selling pressure is fading. To treat a divergence as reliable, filter it three ways: read it on daily or higher timeframes since shorter ones are too noisy, require the divergence to hold across at least two swing highs or lows, and confirm it against price structure rather than trusting the OBV line alone.
Why does OBV lie on some coins?
Because OBV runs entirely on reported volume, and exchange-reported volume can be inflated by wash trading. Market makers or project teams can trade against their own orders, or match buy and sell orders back and forth, to manufacture volume that never involved real capital. Feed that into OBV and you get a confident-looking inflow line built on nothing. OBV is only trustworthy on liquid, real-volume majors like BTC, ETH and top spot pairs; treat it with suspicion on low-cap alts and newly listed contracts, and cross-check against on-chain transfer volume or volume aggregated across multiple exchanges.
What's the best timeframe for OBV?
Daily is OBV's home turf. Its core job — reading medium-term flow direction and confirming breakouts — has the best signal-to-noise ratio on the daily chart. On short timeframes like 15m or 1h, a single abnormal volume spike can yank OBV into a false turning point, so divergence signals fire far more often than they're actually valid. If you trade short-term, you can watch 4h OBV, but always filter it against the daily OBV direction and only take signals where both timeframes agree.
Can I trade off OBV alone?
Not recommended. OBV is a confirmation tool, not a trigger — its strength is checking whether a price move has real volume behind it, not generating precise entries and exits on its own. The right use is as a filter: at a breakout, check whether OBV makes a new high alongside price to judge if it's real; at a key level, watch for OBV divergence as an early warning. Actual entries and exits still need price structure, a trend indicator like MACD, and your own position sizing — OBV only answers one question: is there real money behind this move.
What to read next.
- MACD Playbook: 3 Uses Beyond Golden/Death Crosses — OBV reads volume, MACD reads momentum; signals are strongest when both diverge the same direction.
- Funding Rate Complete Guide — OBV reflects spot flow, funding rate reflects leveraged sentiment; the two complement each other.
- Long/Short Ratio Playbook — read alongside OBV to separate real spot buying from leverage-driven positioning.
- On-chain Six Pack — cross-check OBV against real on-chain transfer volume when exchange volume looks suspicious.
- Position Size Calculator — OBV gives you directional confidence, the calculator caps your downside.
- Full disclosure and disclaimer
Crypto assets are volatile and not suitable for every investor. This page is editorial analysis, not financial advice.