
When the J line climbs past 100 or drops below 0, the KDJ formula is simply doing what it was built to do, and J leaving that range doesn't on its own point to bad data. With K at 76 and D at 62, the final step, J = 3K − 2D, gives 3 × 76 − 2 × 62 = 104. The earlier steps hold K and D between 0 and 100; the J step has no such limit, and the further K pulls away from D, the further J overshoots.
Put KDJ side by side with the Stoch (Stochastic Oscillator) on TradingView or another charting platform and the readings won't line up, because the arithmetic differs. Both start from the same formula, which locates the close within the high-low range of the last N candles. After that, KDJ smooths with a 2/3–1/3 recursion while Stochastic uses simple moving averages, and the usual lookback is 9 for one and 14 for the other.
To check a platform's readings yourself, you need three prices from each candle, the high, the low and the close; every step of the calculation is set out below.
1. The KDJ formula: RSV, K, D and J
Moomoo's Chinese-language help center writes the KDJ calculation as four lines:
RSV (n days) = (Cn − Ln) ÷ (Hn − Ln) × 100K = 2/3 × previous day's K + 1/3 × today's RSVD = 2/3 × previous day's D + 1/3 × today's KJ = 3 × today's K − 2 × today's D
Cn is the close on day n, Ln the lowest low over the n days and Hn the highest high over the n days, with n generally set to 9 days. The help center's name for RSV translates as "immature stochastic value." The same broker's KDJ primer adds two points: if there is no previous day's K or D, 50 can be used instead, and KDJ values range from 0 to 100, though J sometimes goes beyond that.
Take n = 9 and run the four lines all the way through on a made-up set of 11 daily candles. The first 8 days don't add up to 9 candles, so they have no RSV; from day 9 on, each day gets a full set of numbers:
| Day | High | Low | Close | RSV | K | D | J |
|---|---|---|---|---|---|---|---|
| 1 | 6,412 | 6,400 | 6,408 | — | — | — | — |
| 2 | 6,420 | 6,405 | 6,416 | — | — | — | — |
| 3 | 6,428 | 6,410 | 6,422 | — | — | — | — |
| 4 | 6,440 | 6,418 | 6,436 | — | — | — | — |
| 5 | 6,446 | 6,424 | 6,428 | — | — | — | — |
| 6 | 6,460 | 6,426 | 6,455 | — | — | — | — |
| 7 | 6,471 | 6,450 | 6,468 | — | — | — | — |
| 8 | 6,484 | 6,462 | 6,480 | — | — | — | — |
| 9 | 6,500 | 6,476 | 6,495 | 95 | 65 | 55 | 85 |
| 10 | 6,505 | 6,490 | 6,503 | 98 | 76 | 62 | 104 |
| 11 | 6,510 | 6,498 | 6,507 | 97 | 83 | 69 | 111 |
Counting back 9 candles from day 9 gives days 1 to 9. The highest of the 9 highs is that day's 6,500, the lowest of the 9 lows is day 1's 6,400, and the close is 6,495:
RSV = (6,495 − 6,400) ÷ (6,500 − 6,400) × 100 = 95
Day 8 has no K or D, so both start at 50. The table starts from 50 to show how the method works; to compare against a platform's readings, begin further back with more candles, because the first few values are the ones the 50 affects most. 2/3 × previous value + 1/3 × new value is easier to do in your head written as (2 × previous + new) ÷ 3:
- K = (2 × 50 + 95) ÷ 3 = 65
- D = (2 × 50 + 65) ÷ 3 = 55
- J = 3 × 65 − 2 × 55 = 85
On day 10 the 9 candles become days 2 to 10. Day 1 drops out, so the lowest low is now day 2's 6,405, the highest high is that day's 6,505 and the close is 6,503, giving RSV = (6,503 − 6,405) ÷ (6,505 − 6,405) × 100 = 98. This time there is a previous K and D, 65 and 55: K = (2 × 65 + 98) ÷ 3 = 76, D = (2 × 55 + 76) ÷ 3 = 62, J = 3 × 76 − 2 × 62 = 104.
Day 11 looks at days 3 to 11: lowest low 6,410, highest high 6,510, close 6,507, so RSV = (6,507 − 6,410) ÷ (6,510 − 6,410) × 100 = 97, one less than the day before. K = (2 × 76 + 97) ÷ 3 = 83, D = (2 × 62 + 83) ÷ 3 = 69, J = 3 × 83 − 2 × 69 = 111. RSV eased a little, and J went higher.
2. Why K and D stay between 0 and 100 but J doesn't
RSV's numerator is the close minus the lowest low of the 9 candles, and its denominator is their highest high minus their lowest low. The close can't be above the highest high of those 9 candles or below their lowest low, so the numerator falls between 0 and the denominator and RSV falls between 0 and 100: a close at the top of the range gives 100, a close at the bottom gives 0.
K is a weighted average of two parts previous K and one part today's RSV. Both numbers are between 0 and 100 and the average lands between them, so a K that starts from 50 stays inside that range. D runs the same averaging again on K, for the same reason.
The J line's coefficients are 3 and −2. With a minus sign in there, it is no longer an average. Break it apart:
J = 3K − 2D = K + 2 × (K − D)
J equals K plus twice the gap between K and D. On day 10 K is 14 above D, so J = 76 + 2 × 14 = 104; on day 11 the gap is still 14 while K rises to 83, so J is 83 + 28 = 111. This is why J kept climbing on a day when RSV slipped by 1. With K at 76, any D below 64 puts J above 100.
It works the same way in the other direction. Give RSV three days of 5, 2 and 3, again starting from 50: K runs 35, 24, 17, D runs 45, 38, 31, and J runs 15, −4, −11, below 0 by the second day.
K itself tops out at 100, so J can only clear 100 through the distance between K and D. If RSV stays high without changing, D closes in on K day by day, the gap narrows, and J falls back toward K.
3. KDJ vs Stochastic on TradingView: the smoothing and the lookback differ
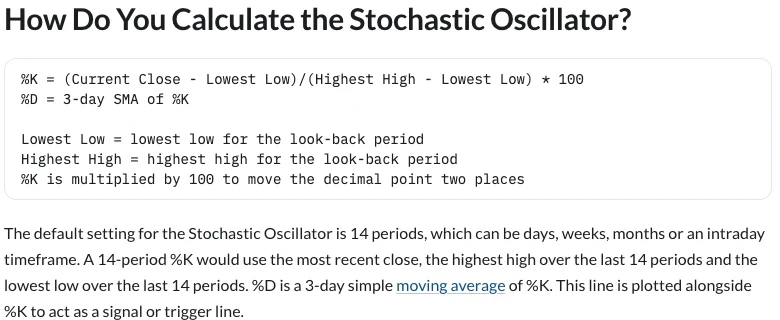
Stoch is short for the Stochastic Oscillator, and StockCharts' ChartSchool covers it in Stochastic Oscillator (Fast, Slow, and Full). George C. Lane developed the indicator in the late 1950s, and it measures the level of the close relative to the high-low range over a given period. The basic formula is %K = (Current Close - Lowest Low)/(Highest High - Lowest Low) * 100, the default setting is 14 periods, and %D is a 3-day simple moving average of %K. This raw %K is the same formula as KDJ's RSV. Stochastic itself comes in three versions: Fast uses this %K as it is, Slow first smooths it with a 3-period simple moving average, and Full lets you set the periods yourself.
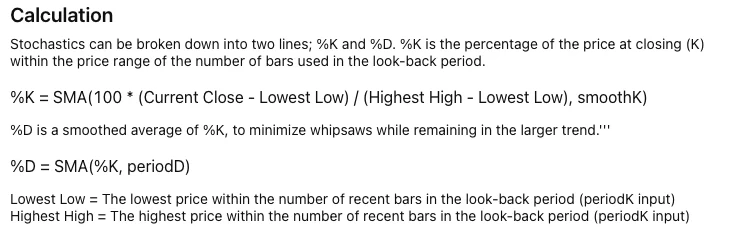
Stochastic's extra layer of averaging is built straight into the formula on TradingView's help page for Stochastic (STOCH):
%K = SMA(100 * (Current Close - Lowest Low) / (Highest High - Lowest Low), smoothK)%D = SMA(%K, periodD)
SMA stands for simple moving average. The three inputs default to 14 for %K, 3 for %D and 3 for Smooth, and a Smooth value of 1 disables the additional smoothing of %K. The chart shows only two lines, %K and %D, both moving between 0 and 100, with no J. The similarly named Stochastic RSI, covered in our Stoch RSI guide, is a separate indicator, so make sure you haven't picked it by mistake when checking readings.
What separates the two is the way they average. A simple moving average looks only at the latest few values and gives each one the same weight: at the default settings, %K is one third each of the latest 3 raw values, and nothing older counts. KDJ's recursion keeps old values in play: today's RSV carries 1/3, the previous day's 2/9, the day before that 4/27, and each step further back is multiplied by another 2/3.
Apply this to day 11. Set Stoch's %K period to 9 as well and keep smoothing at 3, and %K = (95 + 98 + 97) ÷ 3 ≈ 96.67, while KDJ's K is 83. Of that 83, the three RSVs from days 9 to 11 account for 19/27 together, and the remaining 8/27 belongs to older values, which in these 11 daily candles means the starting 50. At the default lookback of 14, the high and low come from 14 candles, so even the raw value from the first step may differ.
| Indicator | First-step formula | Smoothing | Usual lookback | Overbought / oversold lines |
|---|---|---|---|---|
| KDJ (as the broker help center writes it) | RSV = (close − lowest low) ÷ (highest high − lowest low) × 100 | K and D both by 2/3 × previous value + 1/3 × new value | 9 | K 90 / 10, D 80 / 20 |
| Stochastic (TradingView defaults) | 100 × (close − lowest low) ÷ (highest high − lowest low), the same formula | %K and %D both simple moving averages, 3 periods each | 14 | 80 / 20 |
4. KDJ overbought and oversold levels, and readings that stay overbought in a strong trend
Where the overbought and oversold lines go is up to each provider. The Stochastic defaults on TradingView are 20 for oversold and 80 for overbought, which its help page describes as "typical levels" that "may not be suitable for all situations depending on the financial instrument being traded." Overbought, the page adds, "does not always mean a bearish move," and can be "a sign of a strengthening trend and not necessarily an impending reversal."
K above 90 counts as overbought and below 10 as oversold, and D above 80 as overbought and below 20 as oversold, on the broker help center that gives the four-line formula. A KDJ primer elsewhere on the same broker's site draws the lines differently: D above 70 is treated as overbought and below 30 as oversold. All three schemes are set for K and D, which the Stochastic side calls %K and %D; the four formula lines themselves carry no threshold at all.
A reading can also move into overbought territory and stay there. "Overbought readings aren't necessarily bearish," StockCharts writes of the Stochastic Oscillator; securities "can become overbought and remain overbought during a strong uptrend," and closing levels consistently near the top of the range indicate sustained buying pressure, with oversold readings in a strong downtrend working the same way. So it puts identifying the bigger trend first: look for occasional oversold readings in an uptrend and ignore frequent overbought readings. It also warns that "signal line crosses, moves below 80, and moves above 20 are frequent and prone to whipsaw." To gauge how strong a trend is, ADX measures strength alone, without direction. In the 11 daily candles from section 1, the last three closes stay near the top of the 9-day range, with RSVs of 95, 98 and 97.
On the KDJ side, once RSV has stayed high for a while, D catches up with K, the two lines run close together, and crossovers come easily. Take K at 92 and D at 90, and an RSV of 85 the next day: the new K = (2 × 92 + 85) ÷ 3 ≈ 89.67 and the new D = (2 × 90 + 89.67) ÷ 3 ≈ 89.89. K has slipped below D, yet an RSV of 85 still puts the close in the upper part of the 9-day range.
5. The two KDJ settings you choose yourself: lookback and starting value
Does the KDJ formula change if you swap 9 days for another period?
The four lines stay the same; what changes is the stretch of candles RSV takes its high and low from. The broker help center writes the calculation period as n days, n weeks and so on: on a weekly chart with n at 9, RSV uses the highest high and lowest low of the last 9 weekly candles and the close of the last one; set n to 14 and the range is 14 candles. The 2/3 and 1/3 in the K and D lines don't change with n. If a platform's settings panel has other numbers as well, its own indicator documentation is where to find which step each one controls.
Does starting KDJ from 50 throw off the first few days?
The starting value skews the earliest readings, and its effect shrinks with every new candle. Each day only 2/3 of the old K carries over, so the starting 50's share in K is 8/27, about 29.63%, by the third K value, and just 2/3 to the tenth power, about 1.73%, by the tenth. D adds another layer of averaging, so the effect fades more slowly there. When you check readings yourself, start further back with more candles and the starting value leaves less of a trace.