
The taker buy/sell volume panel on Binance's futures trading data page counts which side of each trade was the aggressor, the side taking liquidity. The chart legend shows taker sell volume and taker buy volume, both in BTC, drawn as two separate series. The API's buySellRatio is the ratio between those two volumes. The docs don't state a formula, but dividing the numbers in their own response example gives 387.33 ÷ 248.503 ≈ 1.5586 (the docs give it to four decimal places), which matches the buySellRatio shown there. So the ratio is taker buy volume ÷ taker sell volume.
The key thing is not to treat it as another long/short ratio. A long/short ratio counts accounts and positions (who is holding longs and who is holding shorts). Taker buy/sell volume counts trades (who crossed the spread during this window). On Binance's page they are two separate charts, one above the other. There is also a hard limit written into the docs: only the most recent 30 days of data are kept, with periods from 5 minutes at the finest to 1 day at the coarsest.
1. What it counts: the taker's side, not the position's side.
In the usual matching-engine sense of the word taker, a taker buy is a buy that fills straight away at the best ask, and a taker sell is a sell that fills straight away at the best bid. The side resting on the book and waiting to be filled is the maker, the passive side; the side that crosses the spread to trade is the taker. Every trade has a buyer and a seller, but only one of them is the aggressor, and that is the side this Binance data counts.
Let's be clear about who is saying what here. Binance's API docs list only the field names and give no written definition of taker buy volume. The paragraph above is the general meaning of taker, not a quote from the docs. What the docs do give you is four fields: buySellRatio, buyVol, sellVol and timestamp.
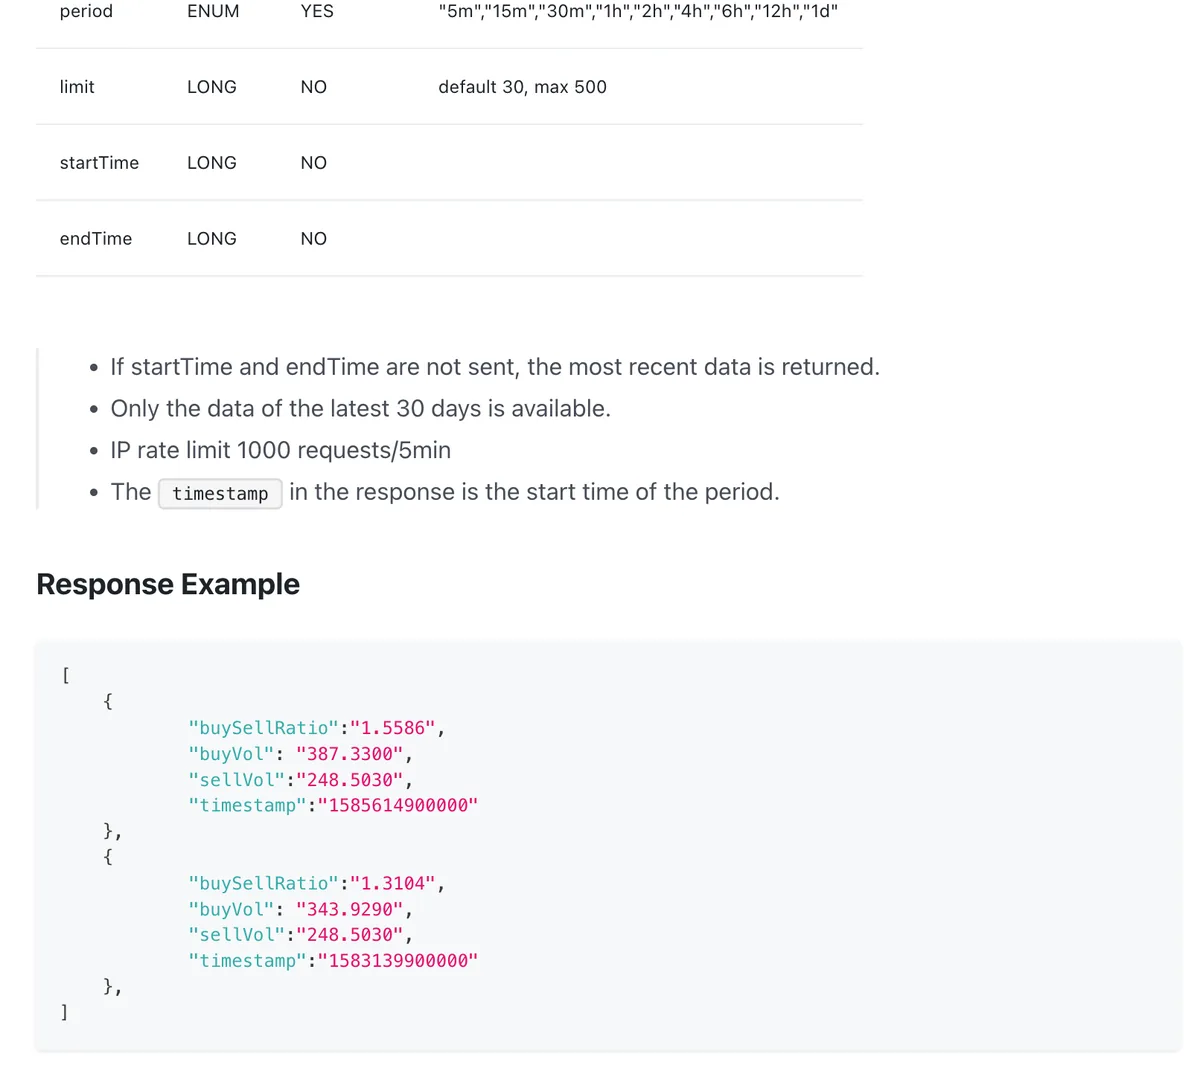
The formula for the ratio is also something we checked by calculation, not something the docs spell out. The Response Example gives buySellRatio 1.5586, buyVol 387.3300 and sellVol 248.5030; divide them and buy is the numerator, sell the denominator. That also means a ratio below 1 is a window where taker selling was the larger volume. Anyone can redo this division with the example numbers on the docs page.
2. Where to find the chart.
On the web it lives on Binance's futures trading data page. It opens on the BTCUSDT perpetual at a 5-minute period by default. Tabs at the top switch between USDⓈ-M futures, COIN-M futures and options, and both the pair and the period can be changed.
From top to bottom, the page runs through these charts: open interest (total open contracts in BTC / total notional in USDT), top trader long/short ratio by accounts, top trader long/short ratio by positions, long/short account ratio, taker buy/sell volume, basis, funding rate (last 7 days), and the ratio of open interest to market cap. Taker buy/sell volume sits below the long/short charts, and if you aren't paying attention it's easy to scroll past it as just one more of them.
One detail worth knowing first: the chart shows the two volumes in BTC, so the ratio is something you either calculate yourself or pull from the endpoint in section 6.
3. How it differs from the long/short ratio.
The difference is what gets counted: one counts trades, the other counts accounts and positions.
| Metric | What it counts | What a ratio of 1.5 means |
|---|---|---|
| Taker buy/sell volume / taker buy/sell ratio | Traded volume in the period, split by the taker's side | Taker buy volume in this window was 1.5 times taker sell volume |
| Long/short account ratio / top trader long/short ratio | Accounts or positions, split by what each side is holding | The long side is 1.5 times the short side (on each metric's own basis: headcount or position size) |
So the two numbers can easily point in opposite directions. Taker buying can dominate for a stretch (a ratio above 1) while the number of accounts holding longs is falling. Those two statements don't contradict each other; they were never counting the same thing. The long/short family itself splits into several methods, by accounts, by positions, top traders versus the whole market, and our guide Long/Short Ratio: Signal, Crowd or Trap? takes them apart one method at a time.
There is one more asymmetry: trades are a flow, positions are a stock. Taker volume describes what happened in these 5 minutes; positions describe what is still on the books right now. The same burst of taker buying could be new longs opening or shorts buying back to close, and this line alone can't tell you which. That is exactly why the next section reads it alongside open interest.
4. How we use the ratio.
What follows is how our editorial desk uses it. Binance's docs contain no rule about what counts as high, and this section doesn't give thresholds either.
Read relative position, not the absolute number. The normal range of the ratio shifts for the same pair across different market phases, and one pair's yardstick certainly can't be carried over to another. What we do is pull the recent ratios for the same pair as its own reference, and see where the current number falls within that distribution. One caveat: the history you can pull covers only 30 days, so the yardstick itself is only 30 days deep.
Read it alongside changes in open interest. Taker buying dominating while open interest rises, and taker buying dominating while open interest falls, are two different situations: the first looks more like new positions coming in, the second more like shorts closing out. How to read the open interest line and where to find it is covered in more detail in Open Interest Guide: The Leverage Still on the Table.
Read it alongside the funding rate. Funding reflects the cost and sentiment on the positioning side; taker volume is the immediate direction on the trading side, and the two were never going to move in step. Settlement timing and what positive and negative rates mean are covered in Funding Rate Guide: Cost, Crowding and Carry. Watching both lines together is steadier than watching either one alone.
Match the periods. If you use the 5-minute ratio, pair it with 5-minute candles and 5-minute open interest; don't use a 5-minute ratio to explain a move on the daily chart. On the API side, period is a required parameter, so the endpoint enforces this one for you.
5. When it tells you nothing.
It can't answer anything older than 30 days. The docs state that only the latest 30 days of data are available, and the period options run from 5m at the finest to 1d at the coarsest. If you want to test whether this metric worked in the last market cycle, the data isn't there, and that question can't be answered with this endpoint.
It is Binance's own measure. The data comes from Binance's own matching engine. Other exchanges and data vendors each calculate their own version, so numbers that don't line up are normal. Before comparing across platforms, first confirm that both sides are counting the same thing.
The ratio jumps around when trading is thin. A ratio is a division, and when the denominator is small, a handful of slightly larger taker sells is enough to push it to an ugly-looking number. The 5-minute period on less-traded pairs is especially prone to this; a longer period is steadier.
The docs don't say how the two volumes are aggregated. Whether liquidation fills are included, or how different contract types are separated, isn't stated on the page. Using it as a directional reference is fine; using it to reconcile exactly against volume data from elsewhere rests on a premise that doesn't hold.
6. Pulling the data yourself: takerlongshortRatio.
The endpoint is documented on the Taker Buy/Sell Volume page of the Binance developer docs (USDⓈ-M futures): GET /futures/data/takerlongshortRatio, weight 0. This article follows that USDⓈ-M page; COIN-M futures have a separate page.
| Parameter | Required | Value |
|---|---|---|
symbol | Yes | Trading pair, e.g. BTCUSDT |
period | Yes | Enum: 5m, 15m, 30m, 1h, 2h, 4h, 6h, 12h, 1d |
limit | No | Default 30, max 500 |
startTime | No | Start time |
endTime | No | End time |
Below the parameter table the docs add four notes: if startTime and endTime are not sent, the most recent data is returned; only the data of the latest 30 days is available; the IP rate limit is 1000 requests per 5 minutes; and the timestamp in the response is the start time of the period. That last note matters most when you read the chart: treat timestamp as the end time and the whole line shifts by one bar, and any cause and effect you then read against the candles will be wrong.
Each item returned has four fields: buySellRatio (the ratio), buyVol (taker buy volume), sellVol (taker sell volume) and timestamp. In the docs' example those first three are 1.5586 / 387.3300 / 248.5030, the same numbers used for the check in section 1.
The live data tools on this site pull from the same kind of public market-data endpoints, not from any private data source. This article is about definitions only, so there is no tool attached to it.
7. FAQ.
What counts as a high taker buy/sell ratio?
Binance's docs give only the fields and their values, with no thresholds of any kind, so there is no universal answer to what counts as high. The ratio itself is taker buy volume divided by taker sell volume; a reading of 1 means taker volume on the two sides was the same size in that period. The only way to judge high or low is to pull recent ratios for the same pair and compare against them yourself, and the history you can pull covers just 30 days, so that yardstick is only 30 days deep.
Is it the same thing as the taker buy/sell ratio on CoinGlass?
This article checked only Binance's own two sources: the taker buy/sell volume chart on the futures trading data page, and the takerlongshortRatio endpoint in the API. What each platform counts, and over what period, has to be confirmed in its own documentation; you can't assume they are the same. Before comparing across platforms, check each one's documentation to confirm that the counted object and the period match.
How much history does this data cover?
Binance's docs say only the latest 30 days of data are available, with periods from 5m to 1d and at most 500 records per request. It's a short-window tool: if you want to test it against a market move from a year ago, the data simply isn't there, and that kind of backtest can't be done with this endpoint.
Should I use the 5-minute or the 1-day period?
It depends on how long a question you're asking. For the direction of taker flow right now, fine periods like 5m and 15m fit better; for which side taker flow leaned toward over the week, 4h or 1d is steadier, and fine periods tend to jump when trading is thin. One principle holds either way: match the periods. Whatever period the ratio uses, pair it with candles and open interest on that same period, and don't mix periods in one explanation.
How is taker buy/sell volume different from ordinary volume?
Volume is the total of all trades, with no direction. Taker buy/sell volume splits the same trades into two lines by the taker's side, taker buy volume and taker sell volume, so the two are parts of one set of trades divided by aggressor direction. The docs don't say how the volumes are aggregated, so don't use it for an exact reconciliation against volume data from elsewhere. What it adds is one extra piece of information: in those trades, whether the side that crossed the spread was the buyer or the seller.
Crypto assets are volatile and not suitable for every investor. This page is editorial analysis, not financial advice.